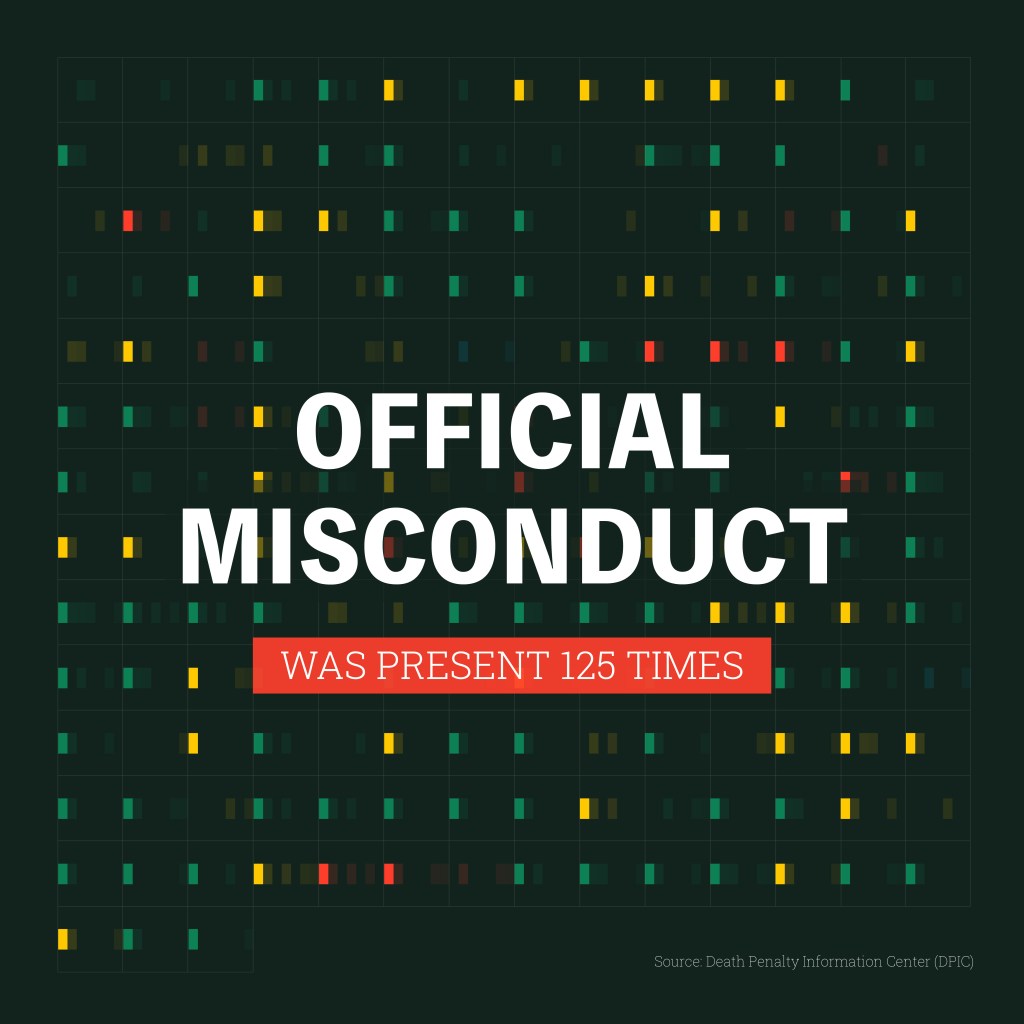
It’s the start of a new year, which means we get to dive into a lot of annual reports that foundations and think tanks have spent a ton of time the prior year compiling. The United States’ use of capital punishment is one of the most abhorrent uses of power that it holds for many reasons, one of which has nothing to do with crimes committed at all – it’s the crimes not committed. The vast number of people that we have found to actually be INNOCENT and then exonerated before execution! How many innocent people have been killed because they could not prove their innocence due to inadequate resources or official misconduct? Do we know?
Since last visualizing death row exonerations in May 2021:
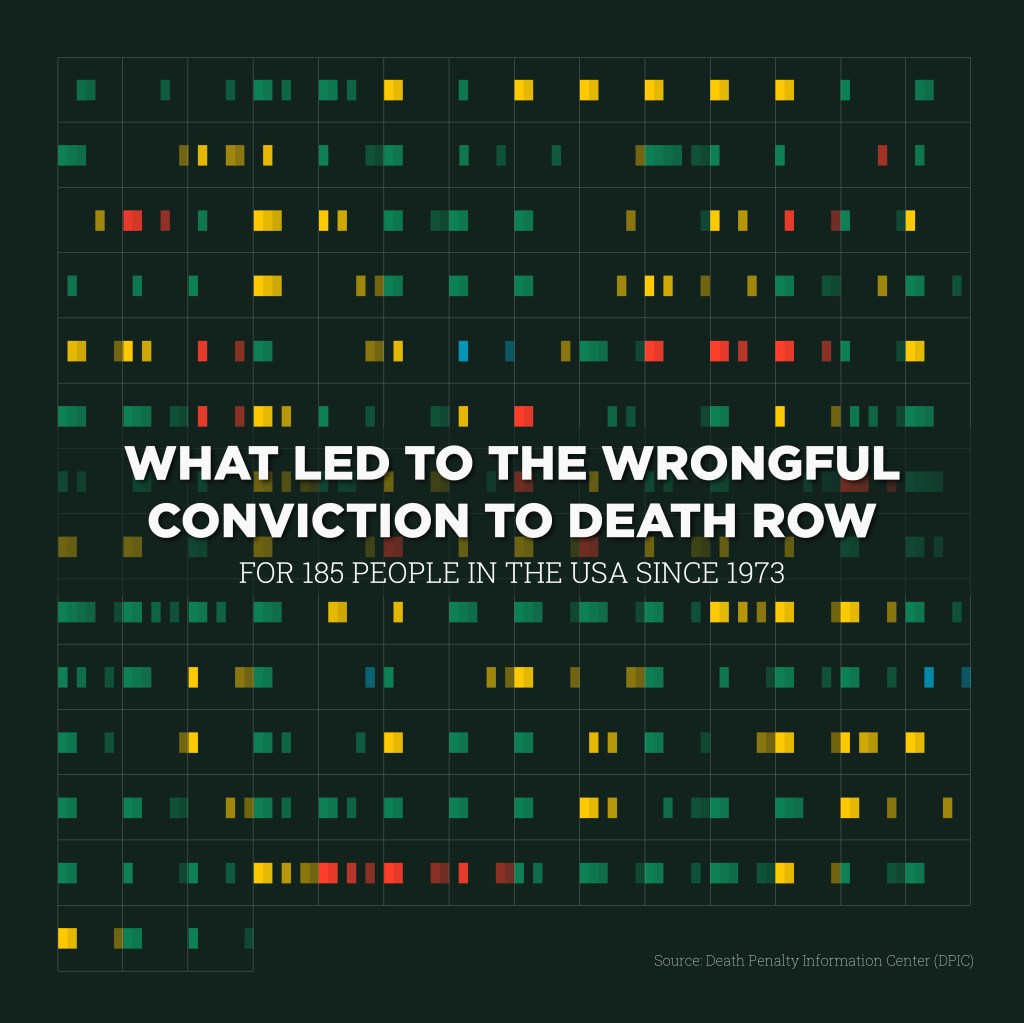
- One more person in the U.S. has been exonerated from death row,
- The rate at which the US has been enforcing the death penalty has been dropping since its peak in 1999,
- Virginia was the first state in the south to abolish the death penalty, and
- The death row population in each state that still has it has either dropped or stayed the same since the prior year.
But at the same time, 11 people on death row were executed in 2021, and an estimated 2,474 incarcerated people are on death row now, waiting to see if and when their lives will end.Data can help us make sense of what is going on and where, so that we can use our power and our voices to change it. But as is always true, nothing can be concluded by data or visualizations alone. It’s our responsibility to learn about the context of that data to truly understand it and become informed enough to challenge the status quo and demand change. I’ll be sharing additional visualizations on these topics to help inform this discussion.
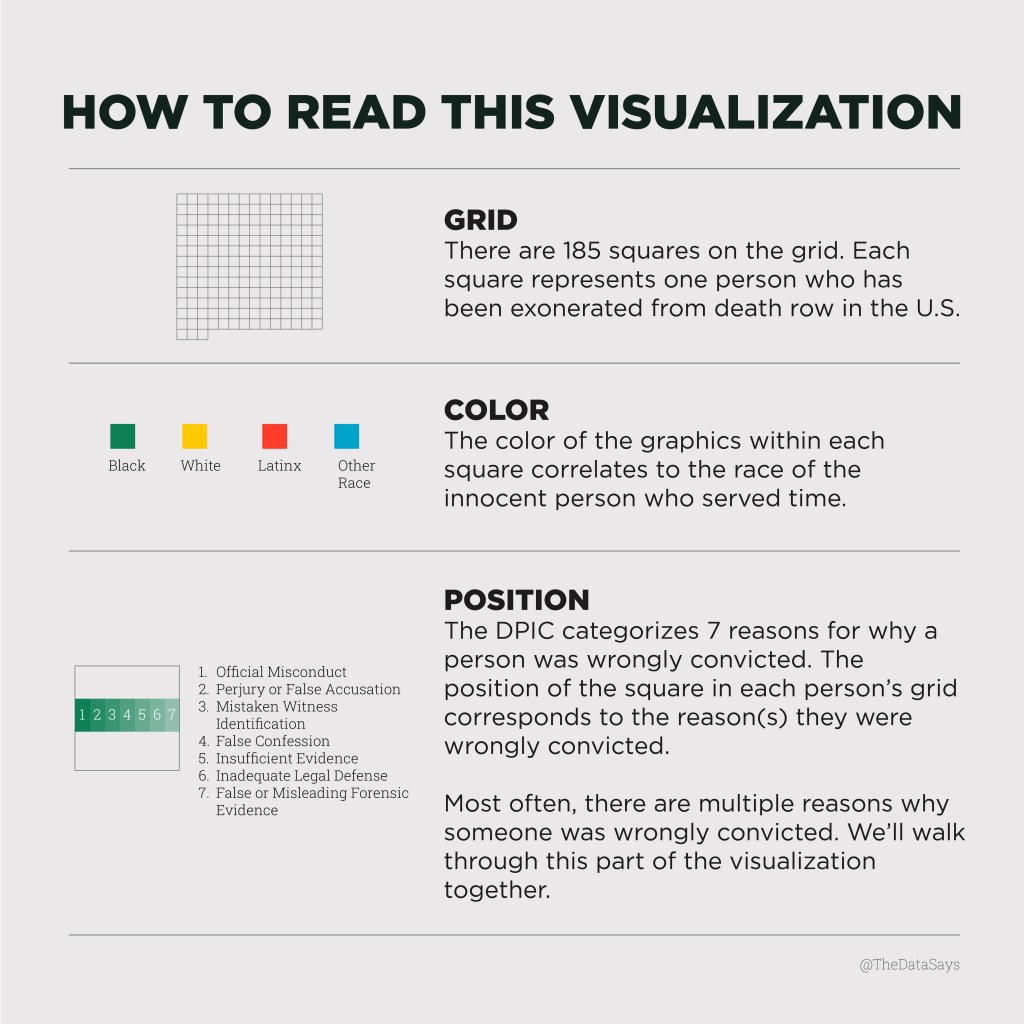
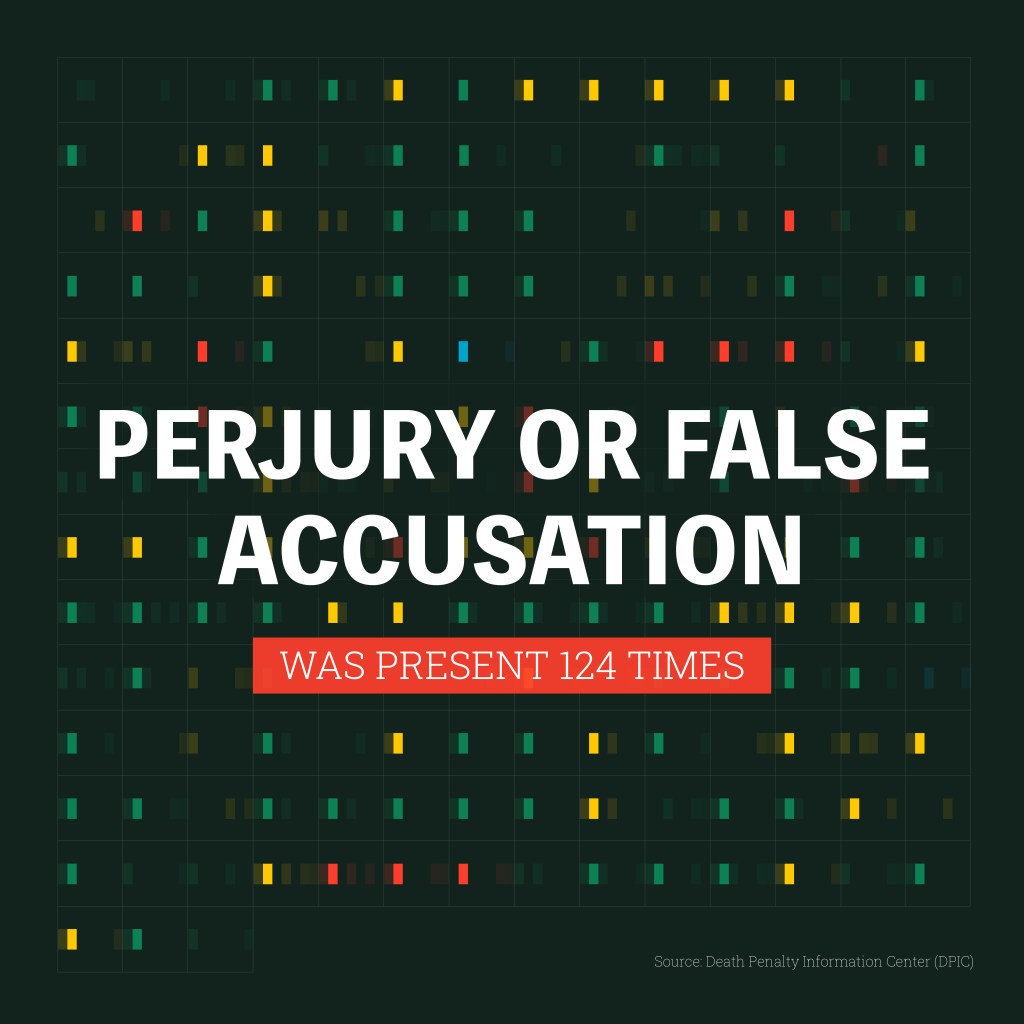
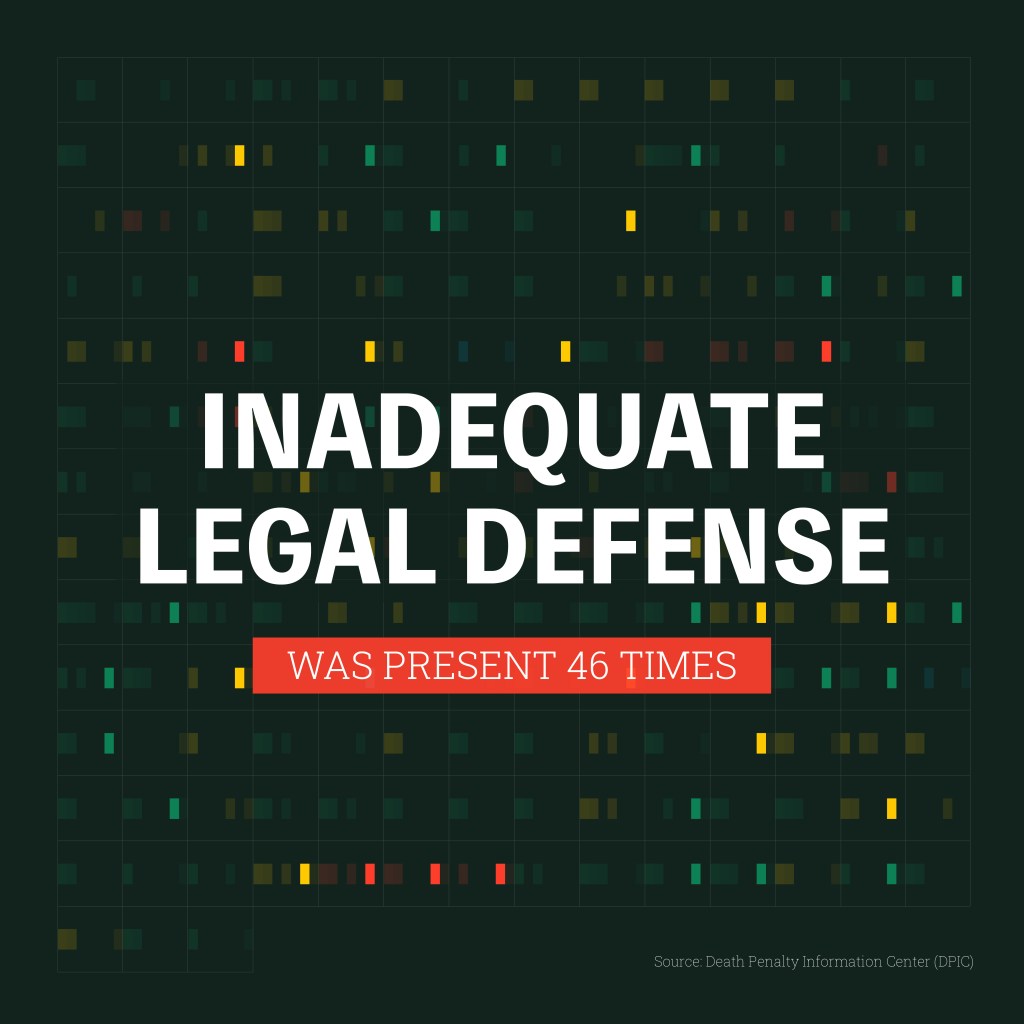
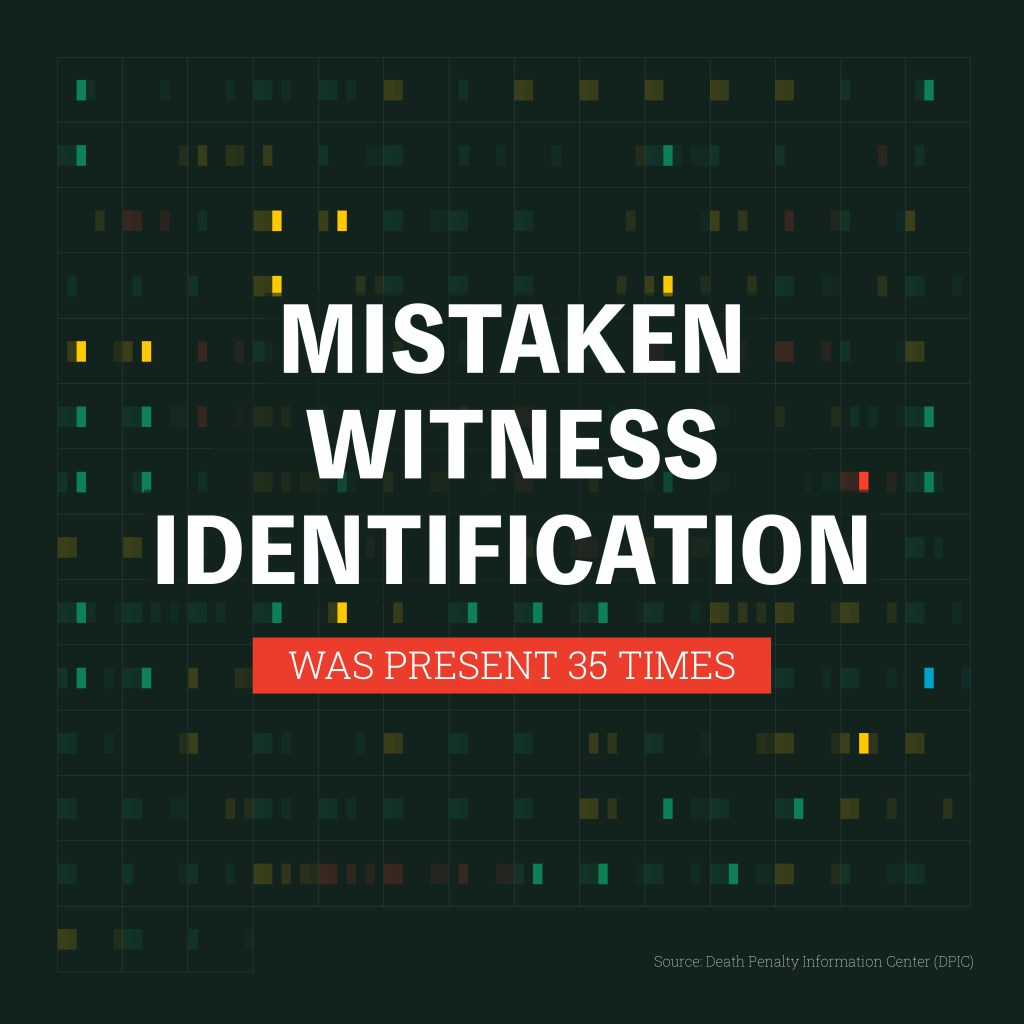
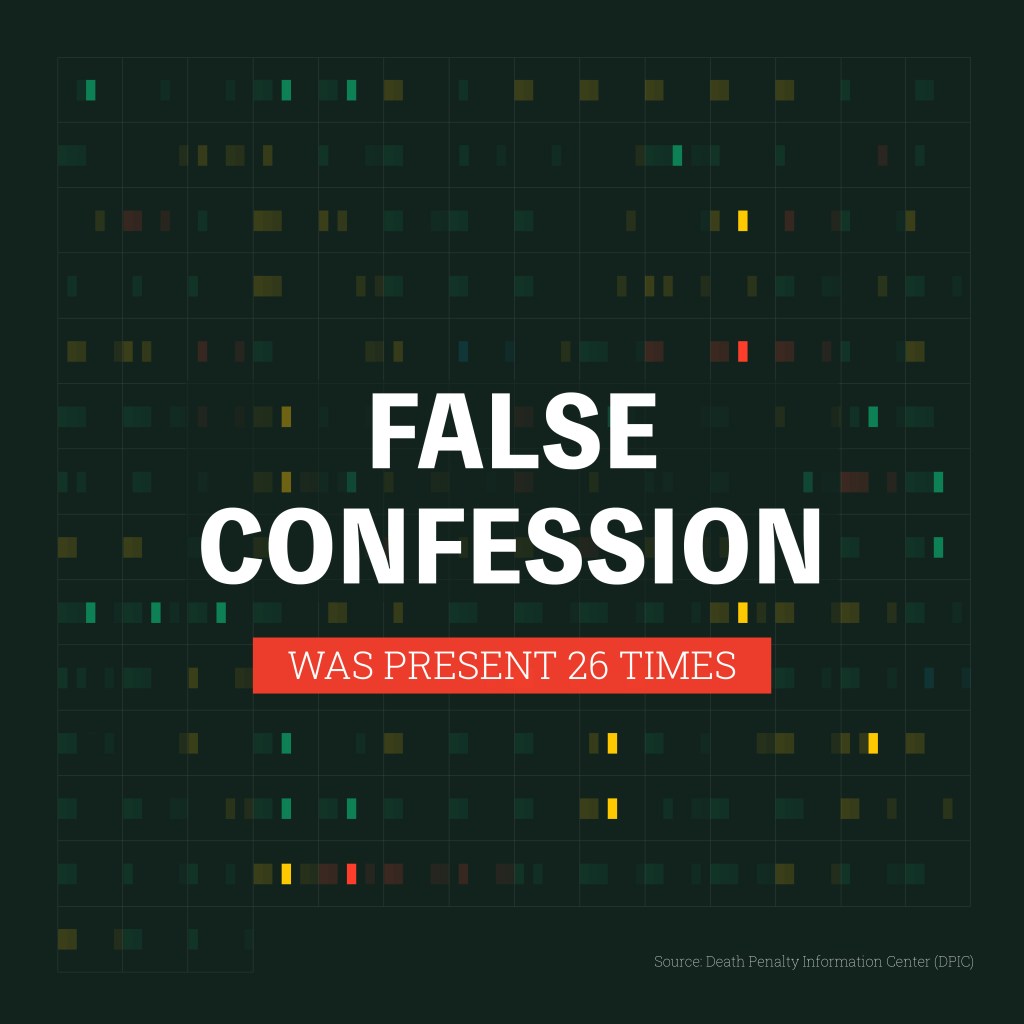
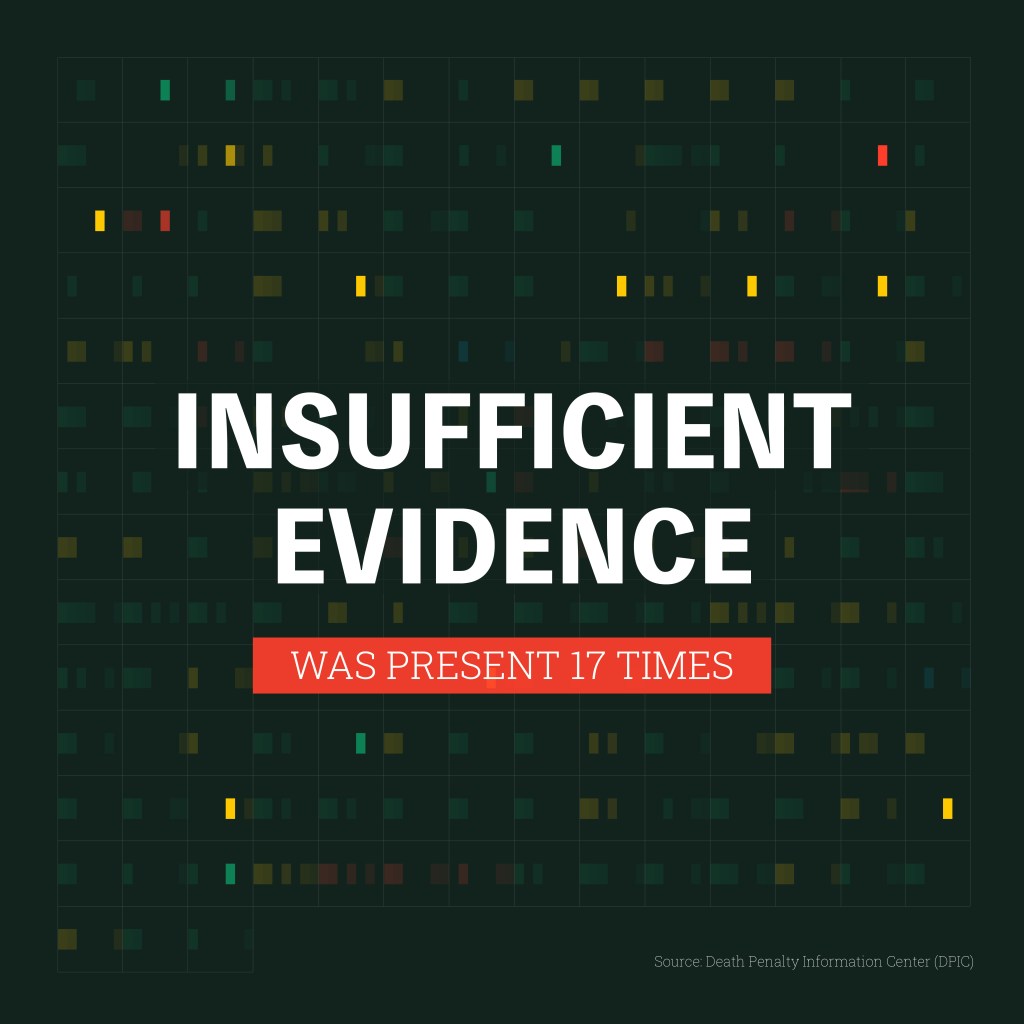
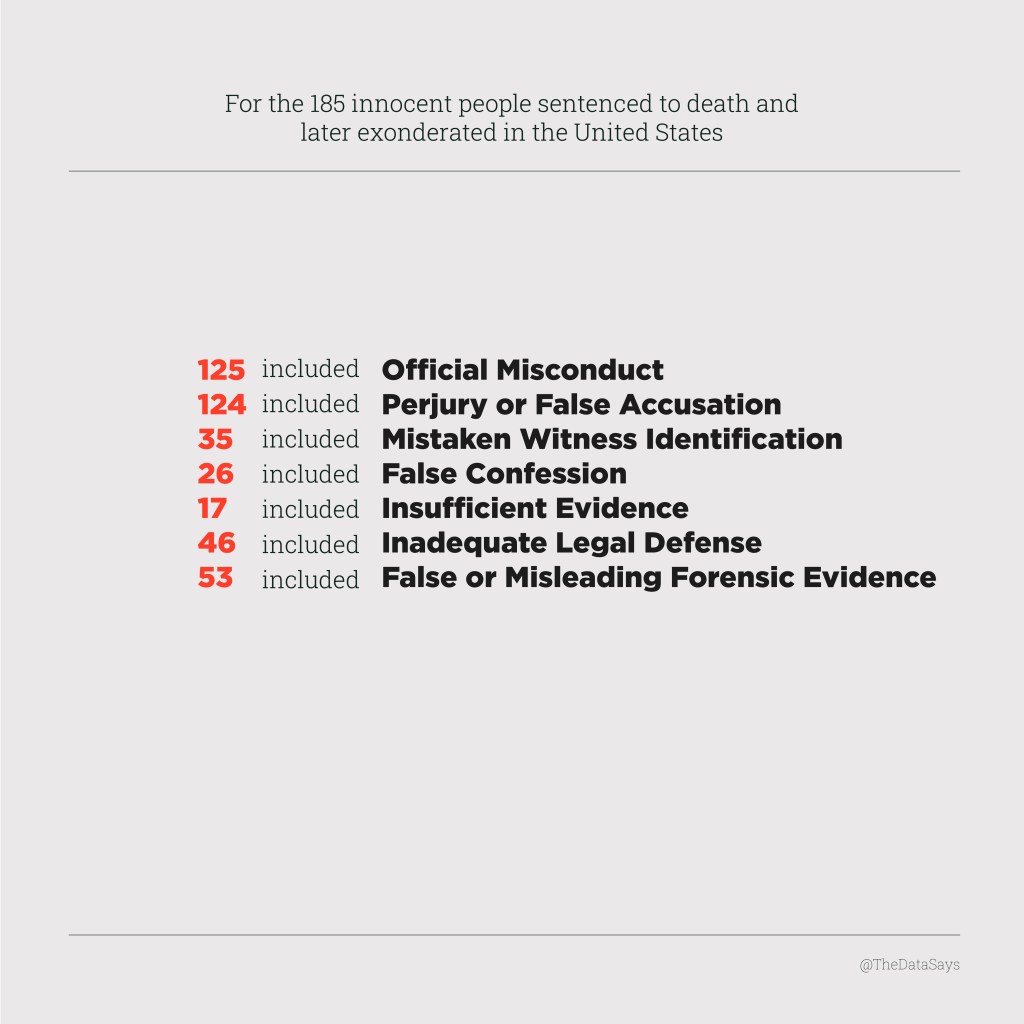
Data Source: Death Penalty Information Center (DPIC)


Leave a comment