Visual Essays of American Politics
Short visual analyses of U.S. Presidents, Supreme Court Justices, Congress, and the American Economy.
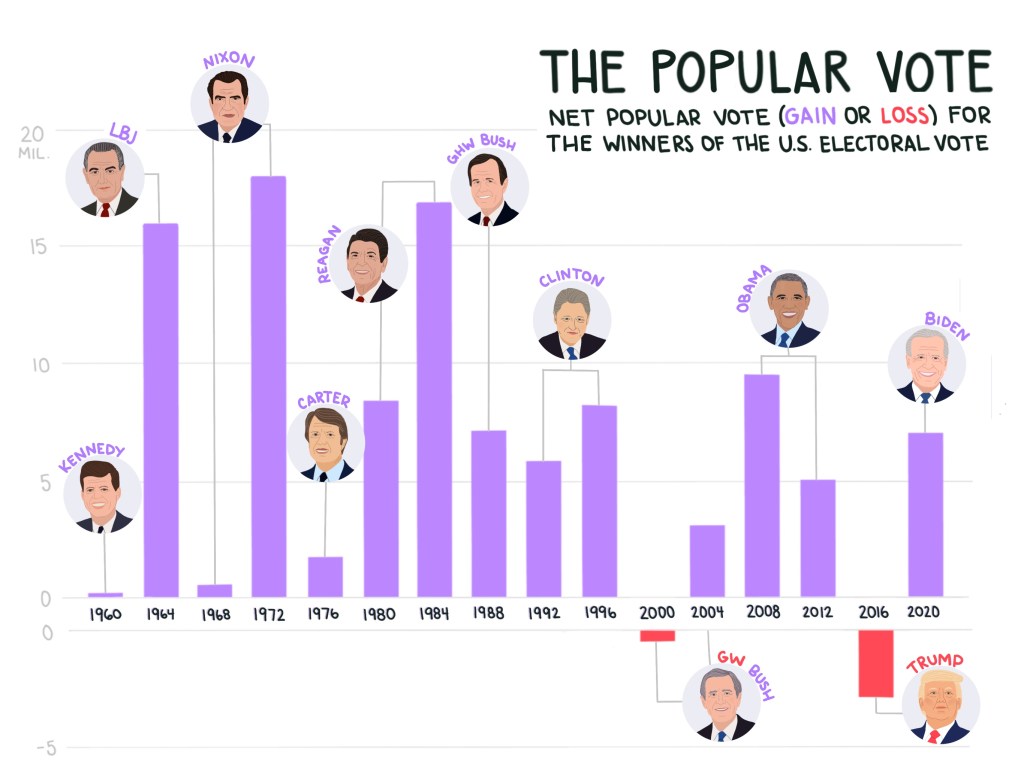
The Popular Vote | January 2021
A candidate doesn’t need to win the popular vote to win the presidential election in the United States. 5 U.S. presidents have been elected through strategic electoral college wins even though they lost the nation’s popular vote. It’s difficult to say what the outcomes might have been in those elections had our democracy used the popular vote to declare the winner in the presidency, like in any other office. How might candidate’s strategies operate differently? How many more people would vote if they knew each vote carried the same weight?
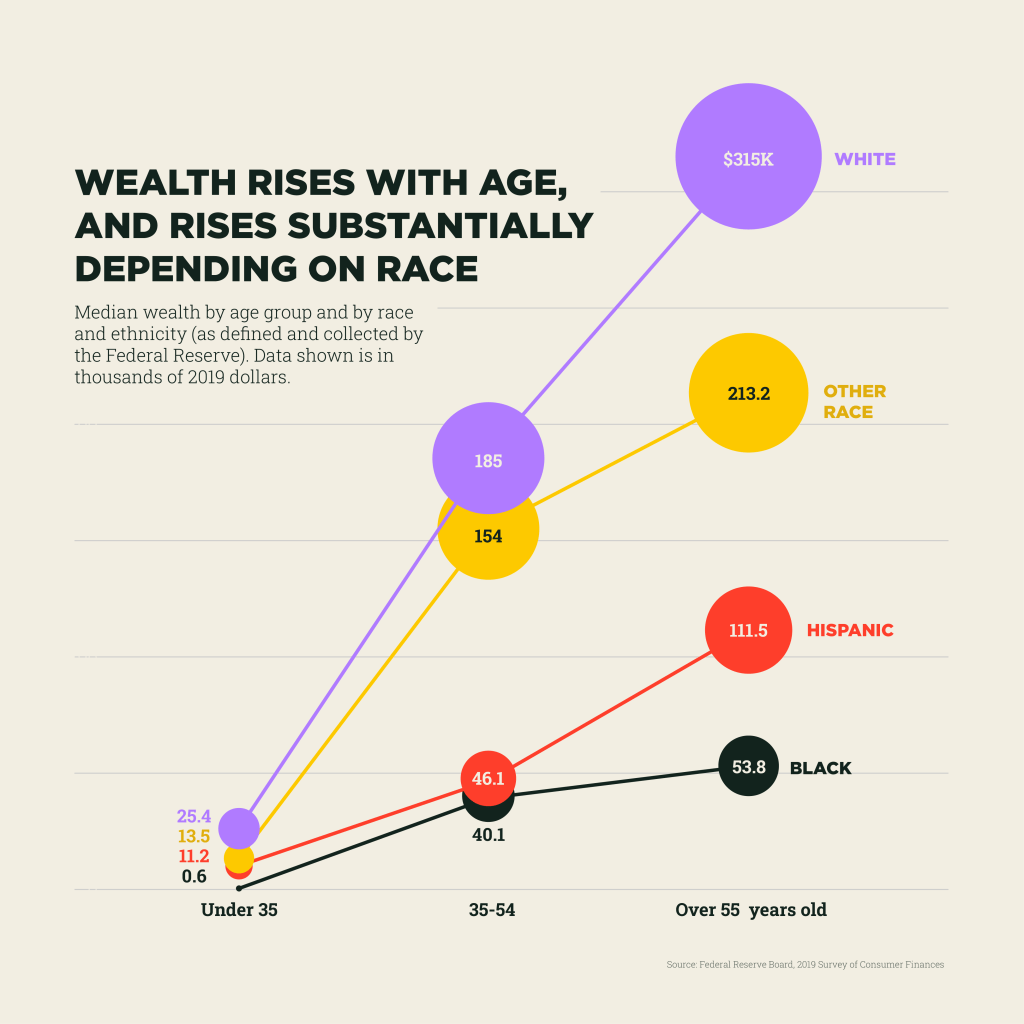
Racial Wealth Gaps | June 2021
We know that the roots of legalized discrimination run deep in America, and we have data to prove many of its consequences. Let’s look at household wealth, for example. In the Fed’s 2019 survey on household wealth (so, pre-pandemic), the organization found these drastic disparities in the median wealth owned by different races. Even young families or households have enormous differences in wealth, particularly between White and Black households, with a median White household owning $25,400 and a median Black family owning only $600. As households get older, across all race and ethnicity groups the wealth rises, but we see even larger disparities between races, again most notably between Black and White households.
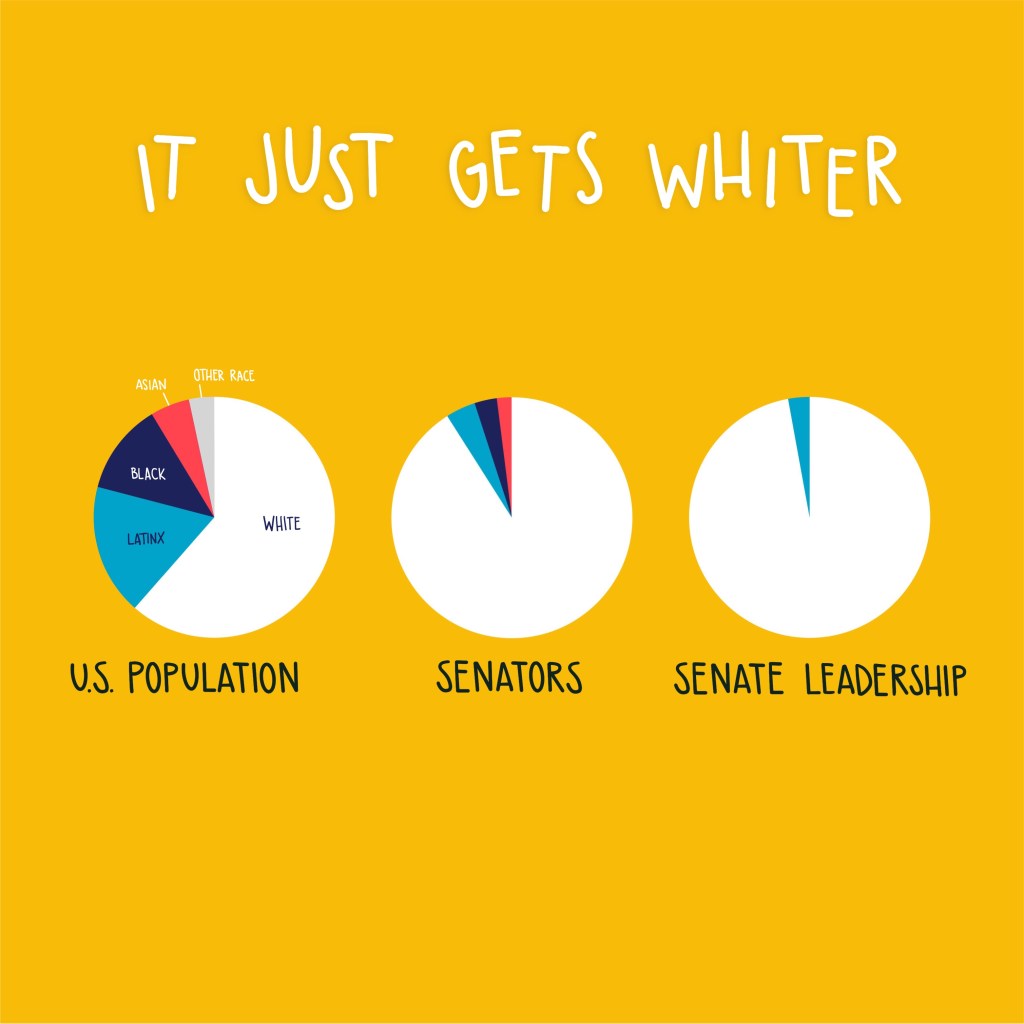
Senate Demographics | June 2020
Our representatives do not have proportionate racial experiences to our population. It gets whiter as you move up the ranks. It’s important to understand where we are so we can vote in the experiences that will drive the change we want to see.
Data for Senate leadership positions is from Senate.gov.
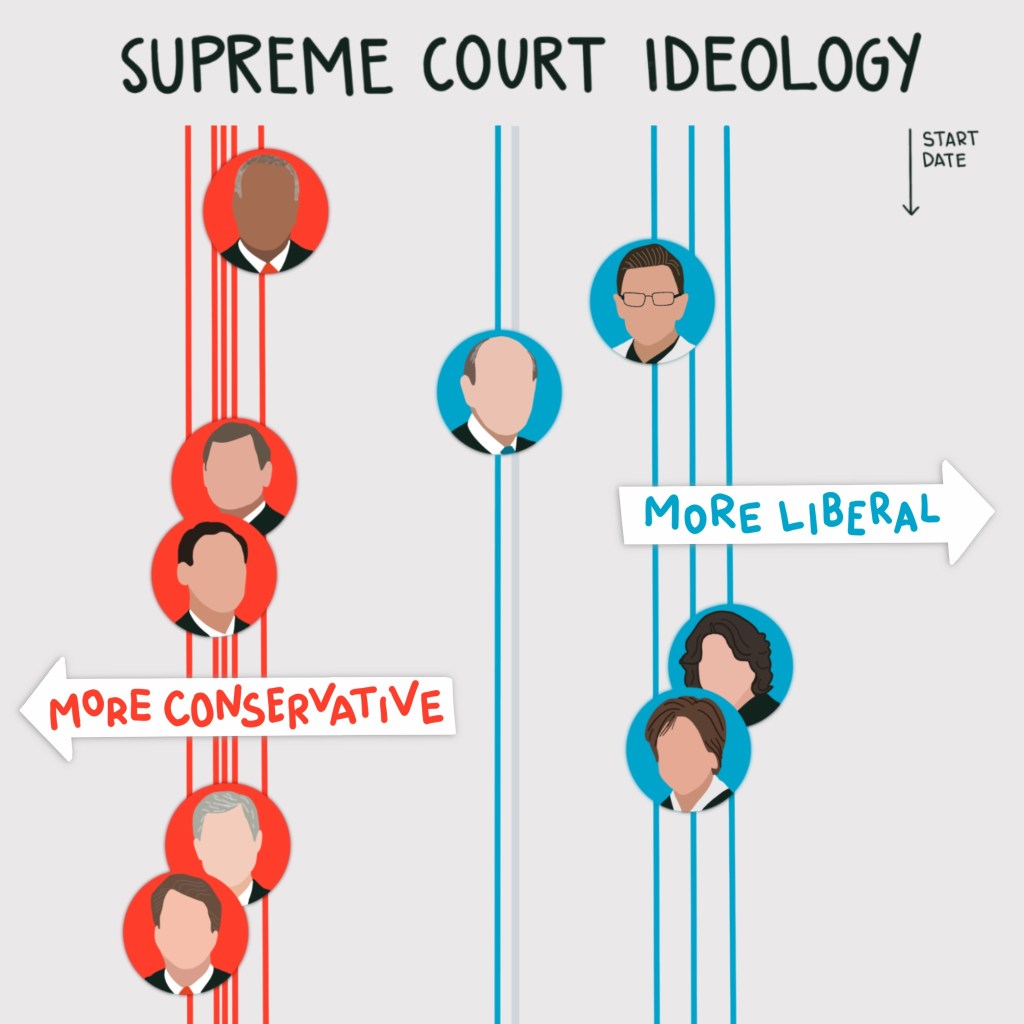
Supreme Court Ideology Scale | September 2020
The passing of Ruth Bader Ginsburg has a profound impact on America, as appointments of new justices are made by the sitting president, who has the ability to push forward their agenda for decades to come through their selection of a new justice.
The current Supreme Court justices (including Ginsburg) are mapped out here by their political ideology score. From the authors of my source, The U.S. Supreme Court Justices Database: “The scores range from 1.00 (most liberal) to 0.00 (most conservative). They were derived through content analyses of newspaper editorials written between the date of the President’s nomination and the date of the Senate’s final action over the nomination.
See Segal and Cover (1989), Segal et al. (1995), and Epstein and Segal (2005) for more details.
